Table of Contents
Understanding relationships between variables is one of the most useful skills in statistics, engineering, and data analysis. Whether you are studying traffic patterns, analyzing economic trends, or working on research, correlation helps you clearly see how different factors are connected.
Correlation Definition
Correlation is a statistical measure that shows the relationship between two variables and how they change with respect to each other.
In simple words, it tells us:
- Whether variables move together
- Move in opposite directions
- Or have no clear relationship
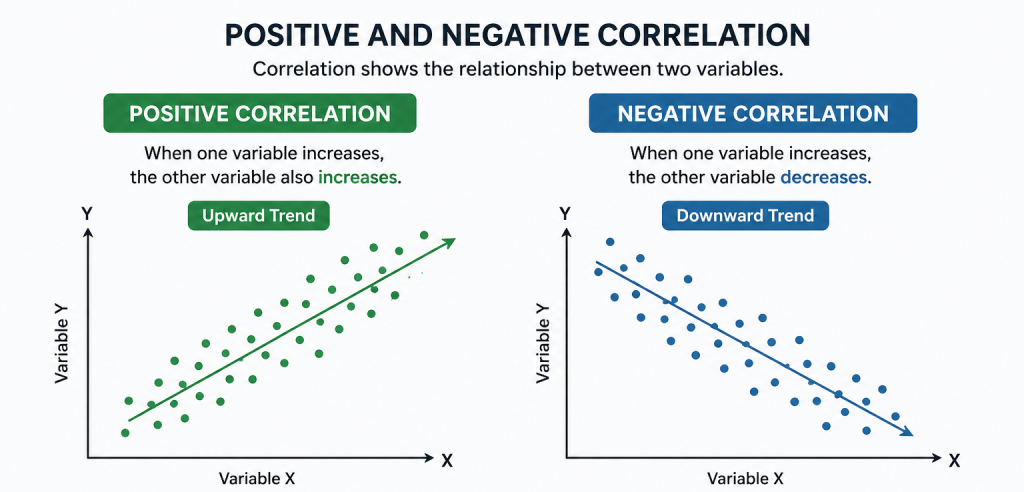
What is Positive Correlation?
A positive correlation occurs when two variables move in the same direction.
This means:
- When one variable increases, the other also increases
- When one decreases, the other also decreases
This type of relationship is very common in real-world situations.
Positive Correlation Examples
Some simple and easy-to-understand examples include:
- Study time and exam score → More study leads to higher marks
- Income and spending → Higher income results in higher expenses.
- Traffic volume and travel time → More vehicles cause longer delays
- Population and housing demand → Growth in population increases housing needs
Strong Positive Correlation
A strong positive correlation means the relationship is very consistent and predictable.
For example:
- If every extra hour of study always increases marks significantly, the relationship is strong
In graphs, this appears as points closely following an upward trend.
Why is it Important to Understand Positive Correlation?
Understanding positive relationships is very useful in both engineering and data analysis.
Importance in Engineering
- Helps in transportation planning (traffic volume vs congestion)
- Useful in structural design (load vs stress relationships)
- Assists in predicting demand for infrastructure projects
Importance in Data Analysis
- Helps identify patterns and trends in datasets
- Supports forecasting and prediction models
- Used in machine learning and statistical modeling
General Benefits
- Improves decision-making
- Helps in resource planning
- Makes analysis more logical and data-driven
How to Interpret Positive Correlation
You can interpret positive correlation using three simple steps:
Direction
Check if both variables are increasing or decreasing together.
Strength
- Strong → very close relationship
- Moderate → noticeable trend
- Weak → scattered pattern
Correlation Value
- +1 indicates perfect positive correlation
- Values closer to 0 indicate weaker relationships
Important note:
Correlation does not always mean one variable causes the other.
What is Negative Correlation?
A negative correlation occurs when two variables move in opposite directions.
This means:
- When one variable increases, the other decreases
- When one decreases, the other increases
Negative Correlation Examples
Here are some simple examples:
- Speed and travel time → Higher speed reduces travel time
- Price and demand → Higher price reduces demand
- Exercise and body fat → More exercise lowers body fat
- Distance from city center and land value → Greater distance reduces land price
Why is it Important to Understand Negative Correlation?
Negative relationships are equally important, especially in solving real-world problems.
Importance in Engineering
- Helps optimize systems (e.g., increasing speed reduces travel time)
- Useful in traffic management and road design
- Assists in improving efficiency of systems
Importance in Data Analysis
- Helps identify inverse relationships in datasets
- Useful for optimization and decision-making
- Helps detect trade-offs between variables
General Benefits
- Supports better planning and control
- Helps reduce negative outcomes
- Improves system performance
How to Interpret Negative Correlation
The interpretation process is similar:
Direction
Check if one variable increases while the other decreases.
Strength
- Strong → clear downward trend
- Weak → scattered data
Correlation Value
- –1 indicates perfect negative correlation
Values closer to 0 indicate weaker relationships
Positive vs Negative Correlation
The difference between positive and negative correlation is simple but very important.
Feature | Positive Correlation | Negative Correlation |
Direction | Variables move in the same direction | Variables move in opposite direction |
Relationship | Direct relationship | Inverse relationship |
Example | Study increases → Marks increases | Speed increases → Time decreases |
Graph Trend | Upward slope | Downward slope |
Correlation Value | Coefficient value ranges from 0 to +1 | Coefficient value ranges from 0 to –1 |
Use | Prediction and growth analysis | Optimization and reduction analysis |
Both positive and negative correlations are essential tools in understanding data and solving real-world problems. Once you understand how variables interact, you can analyze situations more effectively and make better decisions. If you have no idea how to calculate the correlation coefficient, check out my other blog for detailed calculation.