Table of Contents
What is Correlation? Explained Simply
In simple terms, correlation is a statistical concept that helps us understand how two variables are connected. It answers a very straightforward question:
If one thing changes, does the other change as well?
This idea is extremely useful because it allows us to identify patterns and relationships in data without needing complex assumptions.
Let’s look at a few simple examples:
- When income increases, expenses often increase as well
- When rainfall increases, river flow usually rises
- When speed increases, travel time decreases
Each of these examples shows a relationship between two variables. That relationship is what we call correlation.
What Does Correlation Mean?
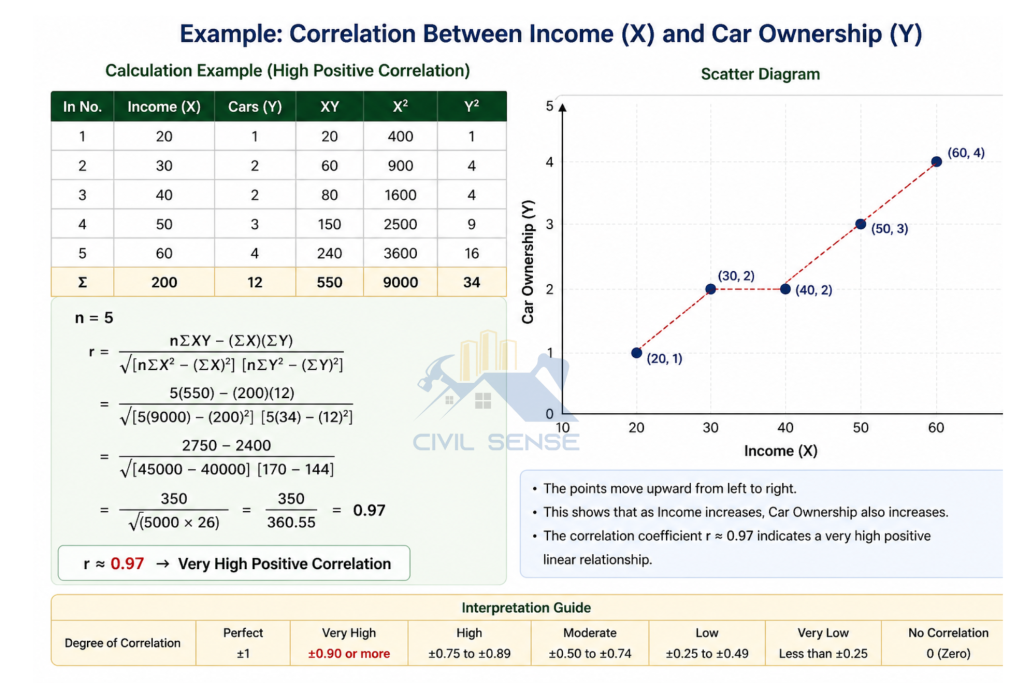
Correlation refers to the degree and direction of association between two variables. It tells us whether variables move together, move in opposite directions, or have no relationship at all.
This concept is widely used in real life. Engineers use it to design better roads, businesses use it to understand customer behavior, and researchers use it to identify trends in data.
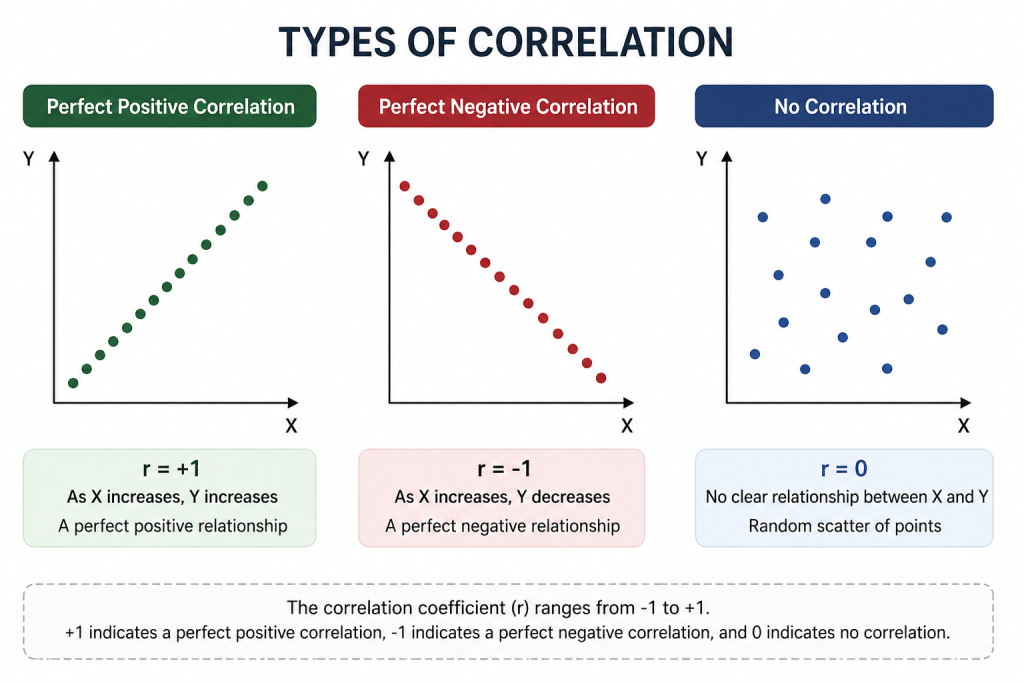
There are three main types of correlation:
Based on degree of correlation:
- Positive correlation
- Negative correlation
- No correlation
Based on the number of variables:
- Simple correlation
- Partial correlation
- Multiple correlation
Based on the Liearity:
- Linear correlation
- Non-linear correlation
However, before going deeper, there is one important concept you must clearly understand:
Correlation does not mean causation.
This means that just because two variables are related does not mean that one causes the other.
For example:
- Ice cream sales increase in summer
- Temperature also increases in summer
But ice cream does not cause heat. Both are influenced by a third factor—the weather. This is why correlation must always be interpreted carefully.
How to Calculate Correlation Coefficient (Step-by-Step)
Once you understand what correlation is, the next logical step is learning how to calculate it. While the mathematical formula may seem complicated at first glance, the underlying idea is quite simple.
To calculate correlation, you need two sets of data:
- Variable X
- Variable Y
These variables must be paired, meaning each value of X corresponds to a value of Y.
For example:
- Income and car ownership
Speed and travel time
Step 1: Collect Data
X (Income) | Y (Cars) |
20 | 1 |
30 | 2 |
40 | 2 |
50 | 3 |
60 | 4 |
Then,
What is the Correlation Coefficient?
To measure correlation in a precise way, we use a numerical value called the correlation coefficient.
The correlation coefficient (usually denoted by r) tells us:
- How strong the relationship is
- Whether the relationship is positive or negative
The value of r always lies between -1 and +1:
- +1 → Perfect positive correlation
- 0 → No correlation
- -1 → Perfect negative correlation
Values closer to +1 or -1 indicate stronger relationships, while values near zero indicate weak or no relationship.
For example:
- r = 0.9 → Strong positive relationship
- r = -0.9 → Strong negative relationship
- r = 0.1 → Very weak relationship
This simple number is extremely powerful because it transforms observations into measurable insights.
Real-Life Applications of Correlation
Correlation is used in almost every field where data plays a role. Understanding it allows individuals and organizations to make better decisions.
Civil and Transportation Engineering
- Traffic volume vs road capacity
- Speed vs traffic density
- Income vs mode choice
Business and Economics
- Advertising spending vs sales
- Price vs demand
- Income vs purchasing behavior
Health and Medicine
- Exercise vs heart health
- Smoking vs lung disease
- Diet vs obesity
Environmental Studies
- Rainfall vs flood levels
- Temperature vs ice melting
- Pollution vs health impact
Data Science and Research
- Feature selection in machine learning
- Identifying relationships in datasets
How to Calculate Correlation Coefficient (Step-by-Step)
In real-world applications, manual calculation is rarely done. Instead, software tools are used for faster and more accurate results.
You can use:
- Microsoft Excel → =CORREL()
- SPSS → Correlation analysis
- Stata → correlate command
- Python / R → Built-in libraries
Positive and Negative Correlation with Examples
Positive Correlation
A positive correlation occurs when two variables move in the same direction.
- An increase in one variable leads to an increase in the other
- Decrease in one leads to a decrease in the other
Examples:
- Income increases → Car ownership increases
- Population increases → Traffic demand increases
- Road width increases → Traffic capacity increases
Positive correlation is useful for understanding growth trends and planning for future demand.
Negative Correlation
A negative correlation occurs when variables move in opposite directions.
- An increase in one variable leads to a decrease in the other
Examples:
- Speed increases → Travel time decreases
- Fuel price increases → Vehicle usage decreases
- Traffic density increases → Speed decreases
Negative correlation helps identify trade-offs and optimize systems.
No Correlation
Sometimes, there is no relationship between variables.
Examples:
- Shoe size vs intelligence
- Rainfall vs exam results